 |
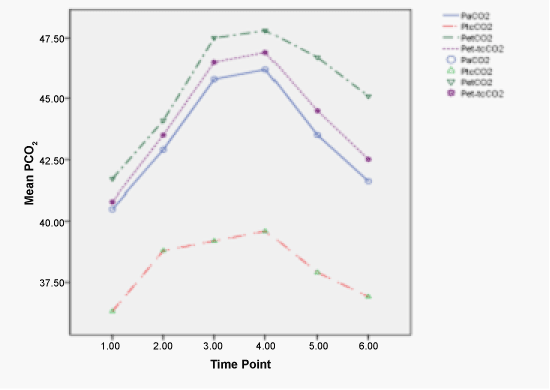
| Figure 3: Pet_tcCO2 matched curve of PtcCO2 and PetCO2 was added to Average course of PaCO2 and PtcCO2 and PetCO2 measurements during sedation. Arterial samples were drawn at six time points: 15, 30, 45, 60, 90, 120 min after the start of data recording; PtcCO2 and PetCO2 were measured continuously. |