 |
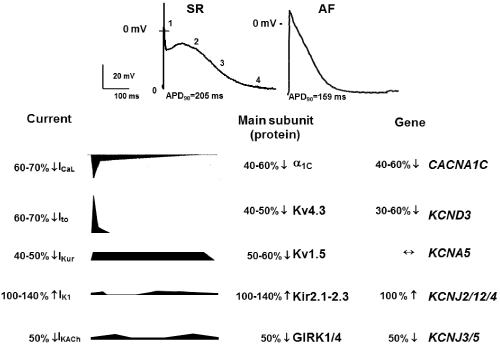
| Figure 2: Major transmembrane ionic currents underlying atrial AP in sinus rhythm (SR) and in AF (ion channel remodeling). Left column presents ionic channel/current densities. Middle and right columns represent that AF induced alterations at the expression level current subunit forming proteins and genes, respectively. Pictograms show the course (magnitude and time duration) of the respective current. Magnitude and time course of the pictogram reflect approximately the real format proportions. Modified from Ref [9] with permission. |