 |
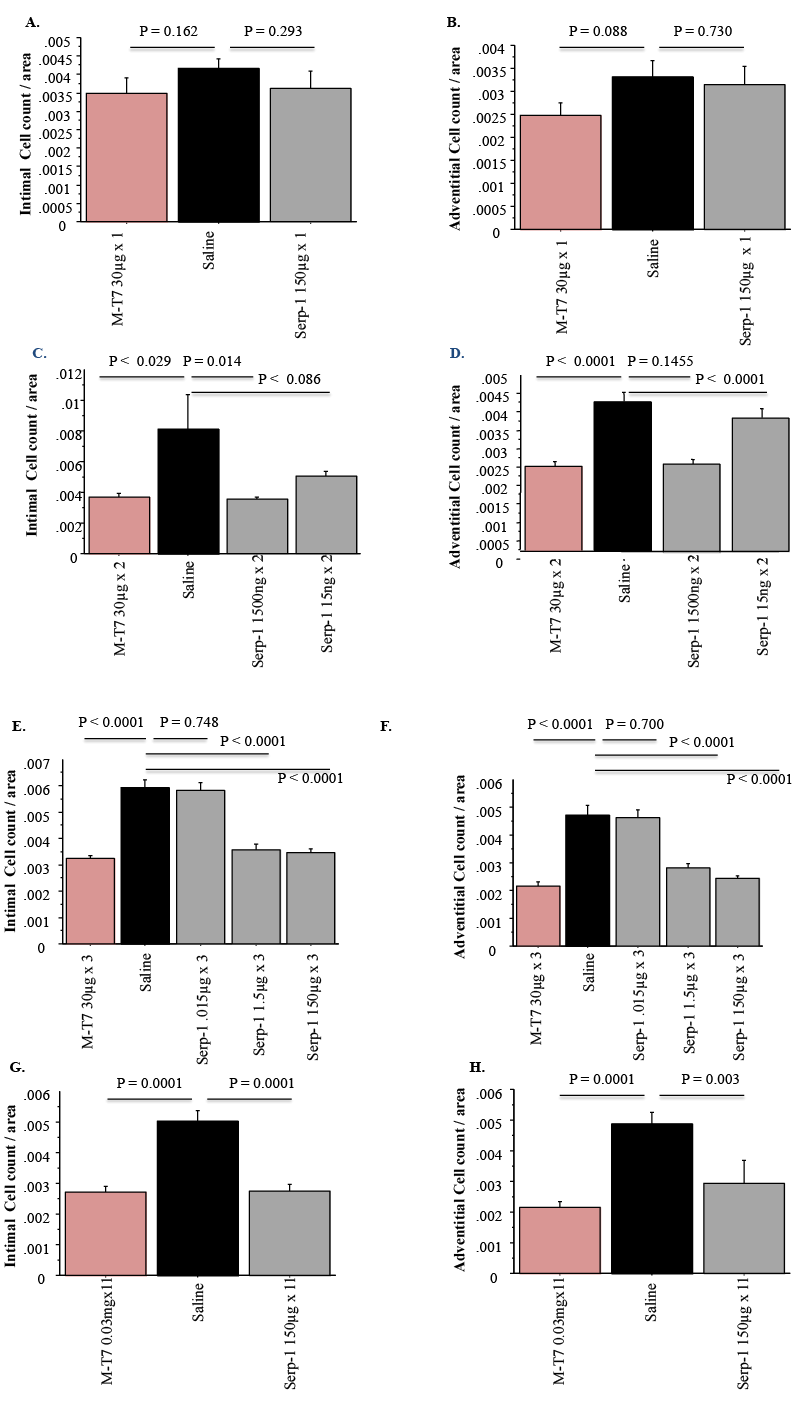
| Figure 5: Mean cell counts for intimal and adventitial layer invading mononuclear cells at sites of stent implant at 4 weeks follow up. Cell counts measured in three high power fields using sites with the largest numbers of invading cells for each count. A. Intimal cell count one day dosing, B. Adventitial cell count one day dosing, C. Intimal cell count two day dosing, D. Adventitial cell count two day dosing, E. Intimal cell count three days dosing, F. Adventitial cell count three days dosing, G. Intimal cell count 11 days dosing, B. Adventitial cell count 11 days dosing. |