 |
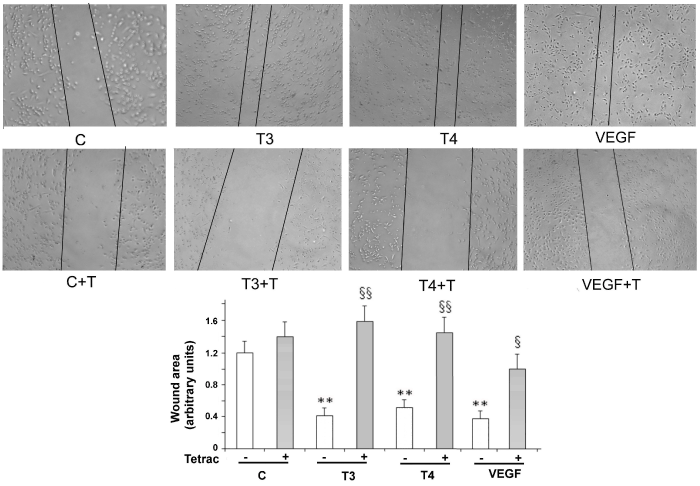
| Figure 4: Evaluation of HMVEC-C migration by scratch assay. Data are reported as wounding area (arbitrary units) measured by image analysis. Representative images of healing in basal condition (C) and after stimulation by T3 (1 μM), T4 (1 μM) or VEGF (1 μM) with or without Tetrac (T), after 48 h. The histogram represents the mean value ± SD (six microscopic fields).*p<0.01 treated cells vs basal control; §p<0.05, §§p<0.01: cells (C, T3, T4 or VEGF) with Tetrac vs the corresponding cells without Tetrac. |