 |
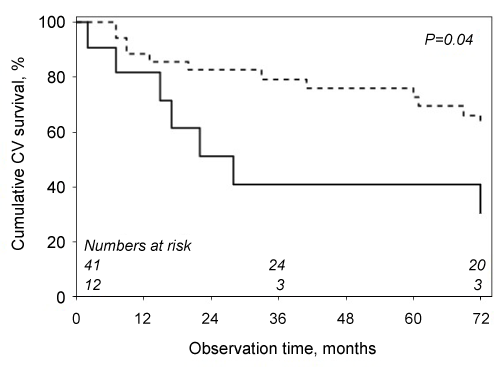
| Figure 1: Kaplan-Meier survival curves for cardiovascular mortality in patients with CACS above 800 Agatston units (solid line) versus patients with lower CACS values (dashed line). Total numbers at risk at baseline, after 3 and 6 years are shown at the bottom of the graph. |