 |
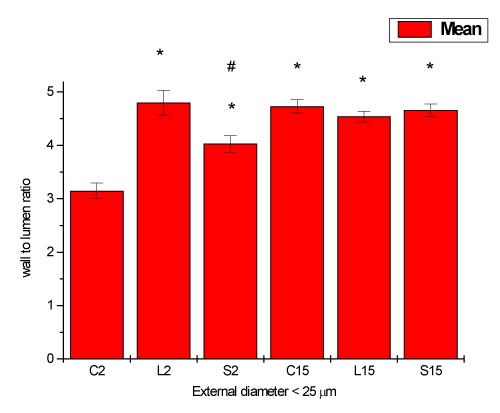
| Figure 3: Bar graph of the wall-to-lumen ratio of renal arteries with external diameters < 25 µm. *P<0.05 vs. C2, #P<0.05 vs. by two-way ANOVA followed by multiple-comparison tests. C2, L2 and S2: control (C), L-NAME (L) and SHR (S) newborns at 2 post-natal days. C15, L15 and S15: control (C), L-NAME (L) and SHR (S) newborns at 15 post-natal days. Values are means ± SEM; n = 5 animals per group. |