 |
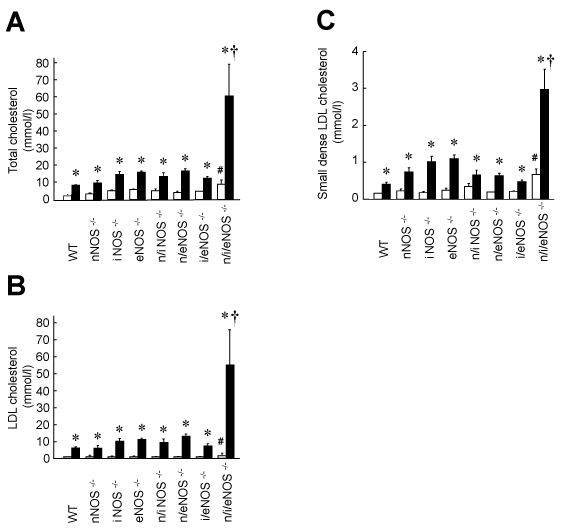
| Figure 4: Serum lipid profile in WT and NOS-/- mice fed a regular or highcholesterol diet for 3 months (n=6-11). White and black bars indicate the regular and high-cholesterol diets, respectively. WT, C57BL/6. *P<0.05 vs. the regular diet; †P<0.05 vs. WT mice fed the high-cholesterol diet; #P<0.05 vs. WT mice fed the regular diet [68]. |