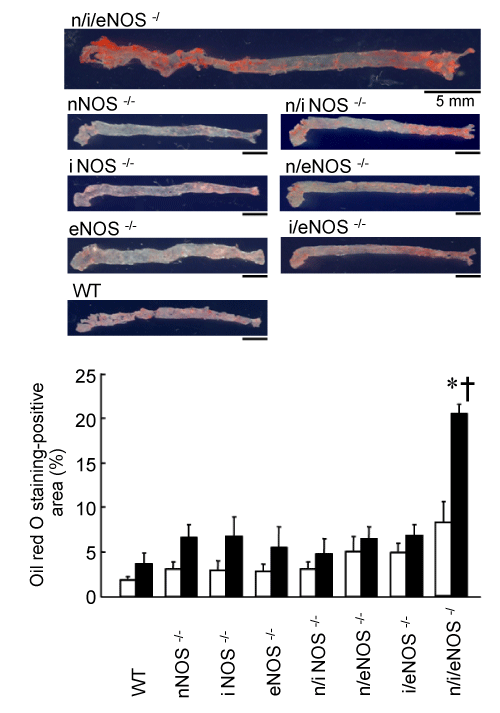
Red color indicates positive staining. White and black bars represent the regular and high-cholesterol diets, respectively. WT, C57BL/6. *P<0.05 vs. the regular diet; †P<0.05 vs. WT mice fed the high-cholesterol diet [68].
 |
| Figure 5: Lipid accumulation in longitudinally opened aortas of WT and NOS-/- mice fed a high-cholesterol diet (oil red O staining) (n=6-11). Red color indicates positive staining. White and black bars represent the regular and high-cholesterol diets, respectively. WT, C57BL/6. *P<0.05 vs. the regular diet; †P<0.05 vs. WT mice fed the high-cholesterol diet [68]. |