|
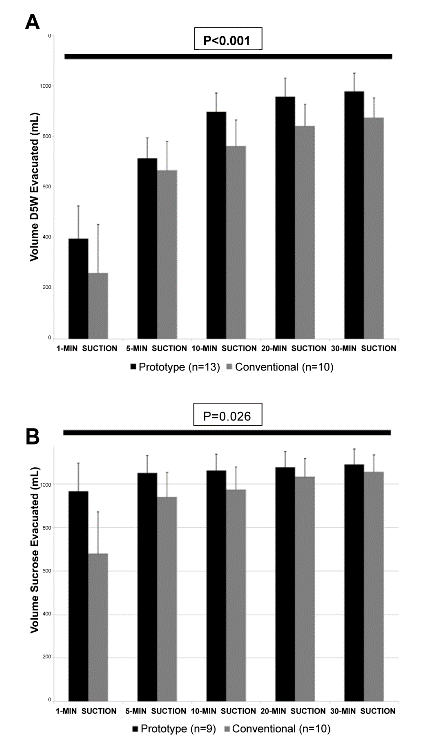
| Figure 3: Fluid drainage by conventional separate tubing (gray bars) and split tube prototype (black bars). Fluid drainage was begun immediately after introduction of 1 litre D5W (Panel A) or 0.58 M sucrose (Panel B) into the thoracic cavity, and was monitored for 30 min. Mean values ± SD; numbers of experiments are indicated in the Table. The overall P values for the ANOVA comparing the two configurations are indicated above the horizontal bar in each panel. |