 |
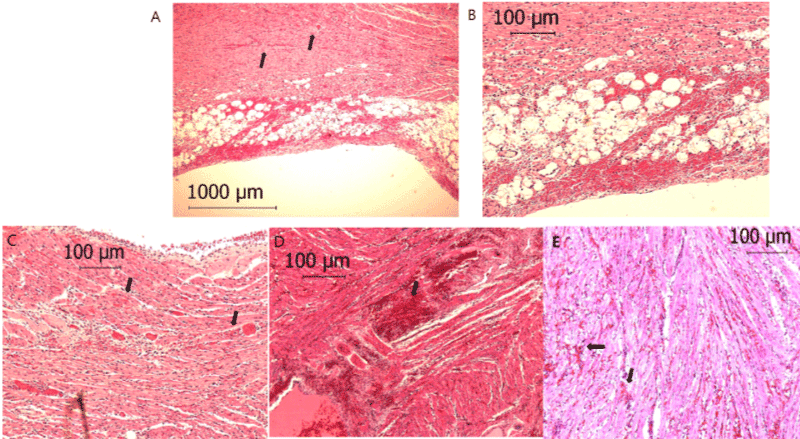
| Figure 2: Epicardial and intramyocardial haemorrhages present at 24 hours following intracoronary collagenase injection. Focal epicardial haemorrhages around epicardial fat was evident in the right ventricle at lower dose (A, B). Haemorrhages and inflammatory cell infiltration in right ventricular subepicardium (C). Intramyocardial haemorrhages and interstitial inflammatory cell infiltration (D). Haemorrhages and inflammatory cell infiltration in right ventricular myocardium and muscle fiber separation was seen (E). Black arrow in panels indicate the haemorrhages: A,B=800 μg; C,D and E=1600 μg. |