 |
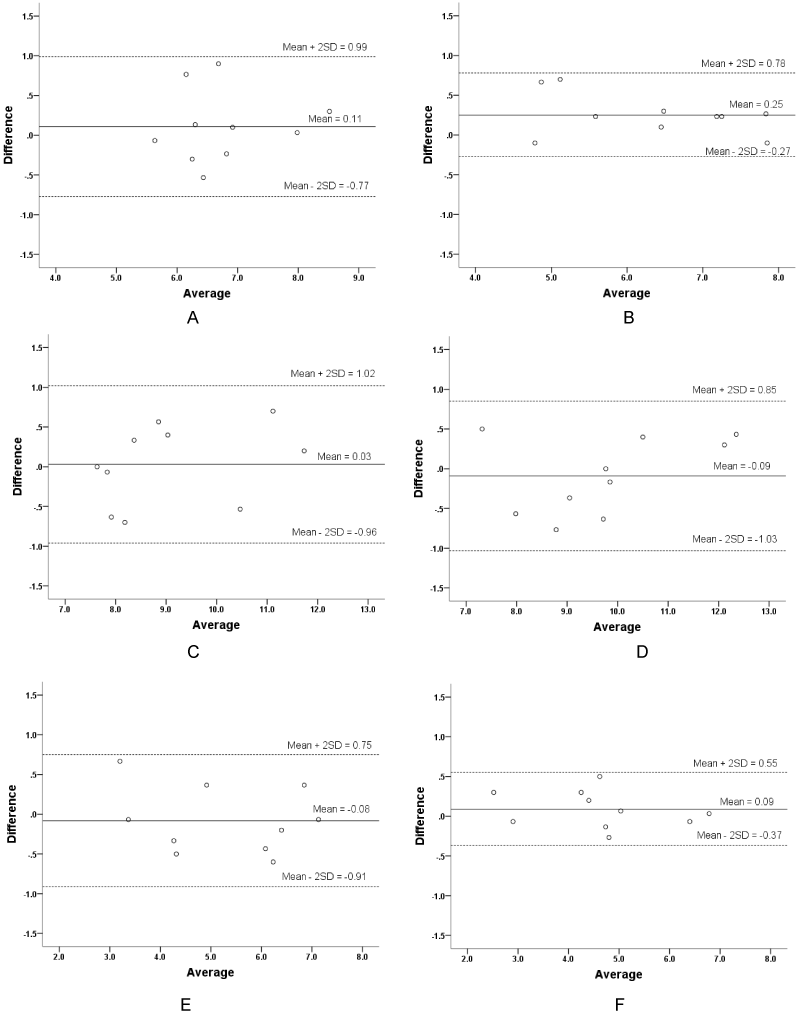
| Figure 4: (a-f) Bland-Altman plots showing the intraobserver agreement of measuring the systolic velocities using TVI (colour coded tissue Doppler imaging) at the septal (a) and lateral sites (b), the early diastolic velocities at the septal (c) and lateral (d) sites and the late diastolic velocities at the septal (e) and lateral (f) sites at the aortic annuli. (n=10). |