|
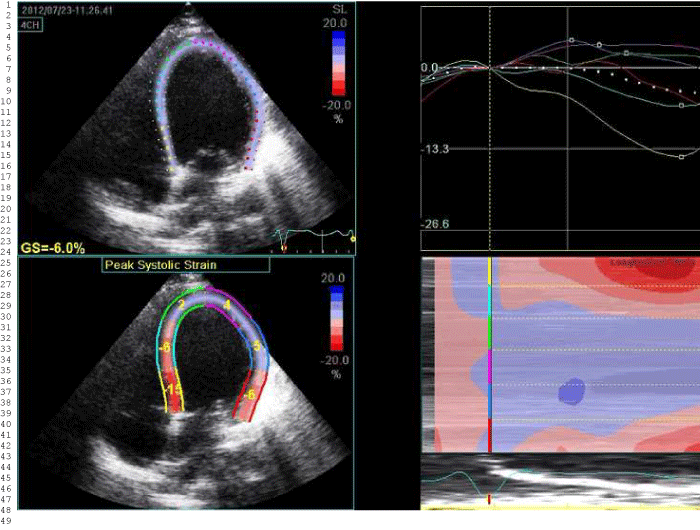
| Figure 5: (Counterclockwise) a. Global strain remarkably impaired. b. Markedly reduced longitudinal strain in the left ventricular apex. c. Graph shows an M wave illustration indicating strain rate during systole. d. 6 segment strain wave through the cardiac cycle (with the basal inferior segment maintaining the best strain). |