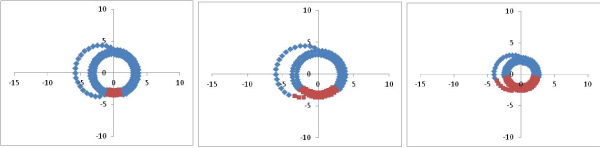
Figure 1:
Cross sections of the ventricles at axial levels 3/18, 9/18, and 15/18. Color differences indicate normal muscle and a representative example of abnormal muscle (bottom) in the distribution of the left anterior descending coronary artery.