 |
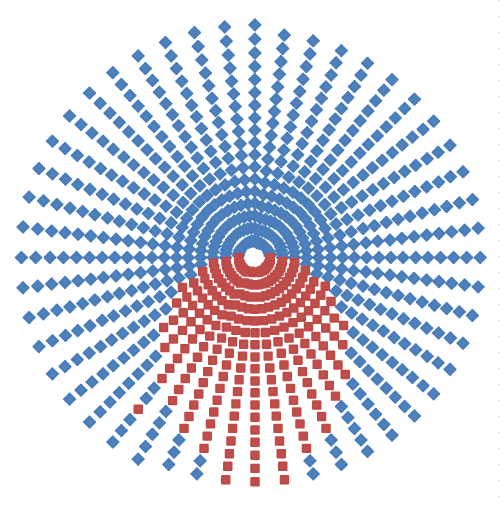
| Figure 2: Target plot of the endocardial layer showing abnormal vs. normal nodes. The subendocardial muscle layer is stretched so that all nodes are visible, anterior at bottom, posterior at top. The abnormal nodes correspond roughly to the distribution of the distal left anterior descending coronary artery. The isolated dot is the focus of the initiating ectopic beat. |