|
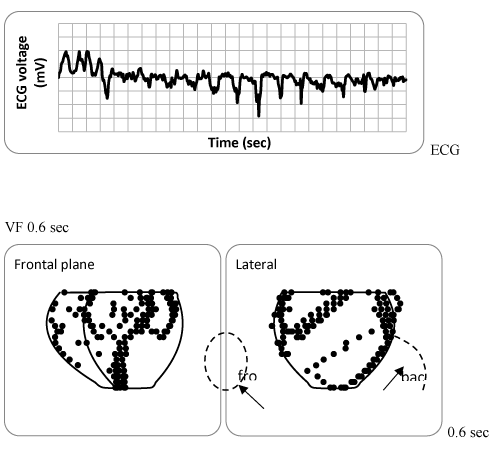
| Figure 4: Simulated electrocardiogram (top) and spatial pattern of nodes activated in the previous 20 msec (bottom) in a model of local abnormal physiology. The absolute values are ERP 0.135 sec and conduction velocity 15 cm/sec in the abnormal, ischemic region. The ischemic region is denoted by dashed curves and arrows. |