 |
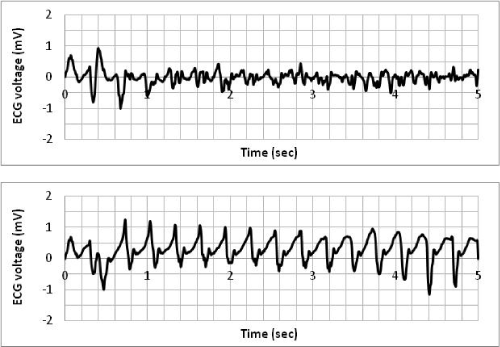
| Figure 6: Simulated ECG patterns of VT/VF with varying pathophysiologic conditions. Here more severe reduction in refractory period produces coarser, not finer, ECG waveforms. Top tracing ERP ratio 0.5, velocity ratio 0.2. Bottom tracing ERP ratio 0.27, velocity ratio 0.2. |