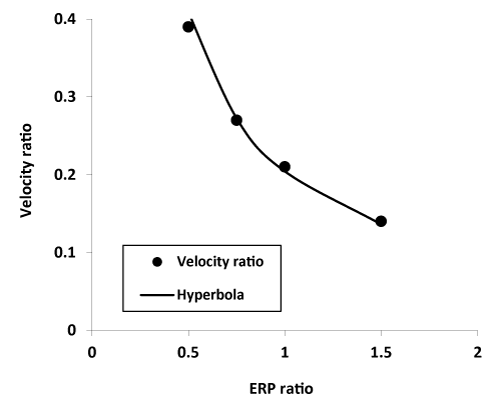
(y=0.21/x). This curve represents a nearly 80 percent reduction in impulse wavelength in the abnormal region of muscle.
 |
| Figure 9: Border in two dimensional parameter space between stable
physiologic conditions, above the curve, and unstable physiologic conditions,
below the curve. Here the parameters refer to conditions in the localized
region of abnormal or ischemic tissue, namely the relative reduction in impulse
conduction velocity on the vertical axis and relative reduction in refractory
period on the horizontal axis. Data points come from numerical experiments.
The smooth curve is a hyperbola that represents a constant product of the
two variables or 0.21 (y=0.21/x). This curve represents a nearly 80 percent reduction in impulse wavelength in the abnormal region of muscle. |