 |
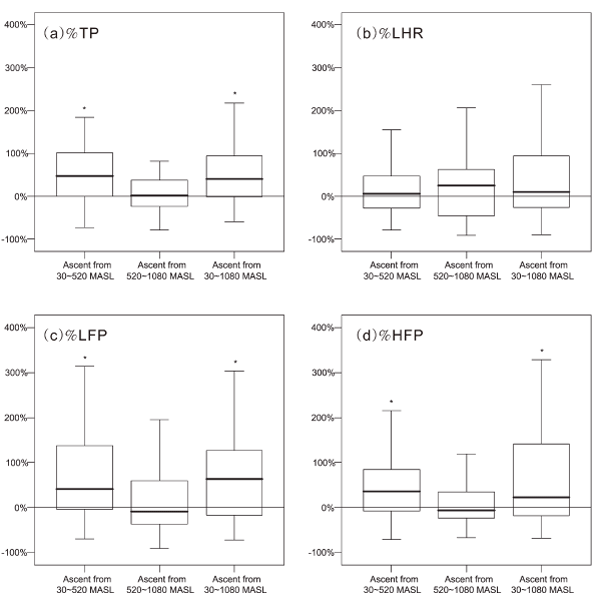
| Figure 1: Percentage changes in HRV measures of total power (a, %TP); low-/high- frequency power ratio (b, %LHR); low frequency power (c, %LFP) and high frequency power (d, %HFP) among different altitude ascents, respectively. *p<0.05 vs. Ascent from 520 to 1080 MASL. Box represent median and IQR (interquartile range, 25th to 75th percentile), whiskers represent maximum 1.5 IQR values of upper and lower quartile. |