 |
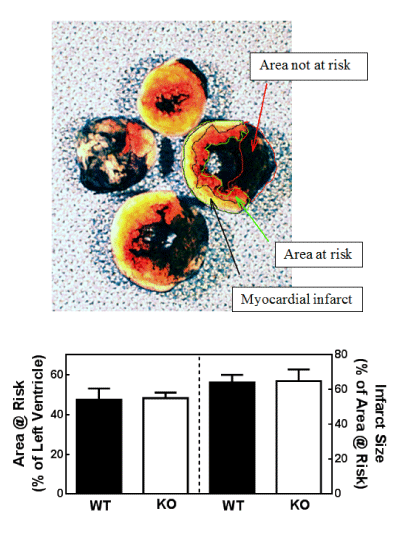
| Figure 3: Area at risk and myocardial infarct size following 30 min myocardial ischemia and 24 hour reperfusion injury. A: Representative photograph of mouse heart sections stained with TTC and Evans blue dye after 30 min myocardial ischemia and 24 hour reperfusion; myocardial infarct (white), area at risk (white and red), and area not at risk (dark blue). B: Area at risk assessed as a percentage of the left ventricle area, and myocardial infarct size assessed as a percentage of area at risk. WT and TRPV4-/- (KO) mice (n=4/group) were compared by unpaired t-tests for both endpoints. |