 |
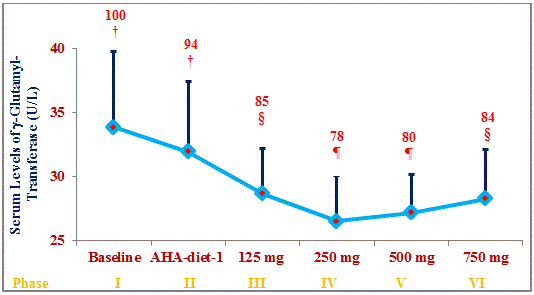
| Figure 6: Role of various doses of δ-tocotrienol plus AHA Step-1 diet on serum levels of γ-glutamyl-transferase (γ-GT) in hypercholesterolemic subjects: The treatments I-VI corresponds to six phases, and each phase lasted for 4 weeks- I: baseline (n=31); II: AHA Step-1 diet; III: δ-tocotrienol 125 mg/d+AHA Step-1 diet; IV. δ-tocotrienol 250 mg/d+AHA Step-1 diet; V: δ-tocotrienol 500 mg/d+AHA Step-1 diet; VI: δ-tocotrienol 750 mg/d+AHA Step-1 diet. Data are means ± SD (standard deviation). Percentages of each treatment compared to baseline values are above the column. Points on a line not sharing a common symbol are significantly different at §P<0.01; ¶P<0.001. |