 |
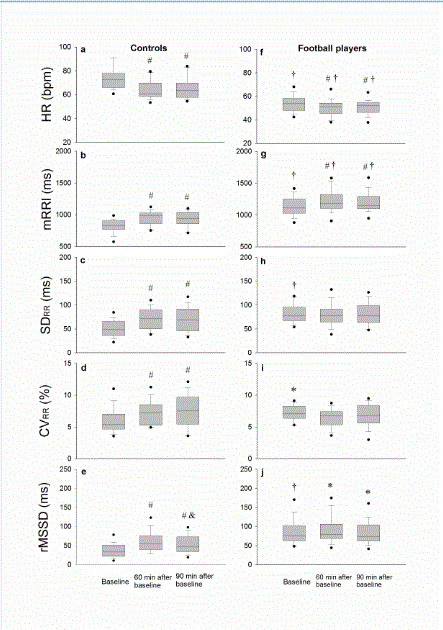
| Figure 2: Sequential change in time domain HRV measures of the control subjects and football players at rest. BPM: Beats Per Minute; MS: Millisecond. Data are presented as medians (25%~75%). #p<0.05 vs. baseline measurement; and p<0.05 vs. 60 minutes after baseline measurement; *p<0.05 vs. counterpart of the control; ‡p<0.01 vs. counterpart of the control (Friedman repeated measure ANOVA on ranks with post hoc Student-Newman-Keuls test). (a), (f) Heart rate (HR); (b), (g) Mean RR interval (mRRI); (c), (h) Standard deviation of RR intervals (SDRR); (d), (i) Coeficient of variation of RR intervals (CVRR); (e), (j) Root mean squared successive difference (rMSSD). |