|
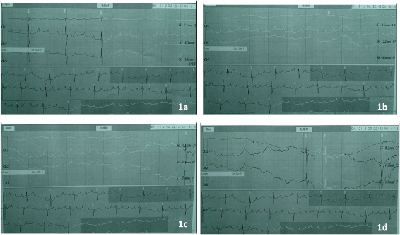
| Figure 1: Shows the P waves on the Holter recording without a ventricular response. Figures 1a to 1d are the sequential images in the 20 second event. The event started around 15:35:50 (Figure 1a) and continued till 15:36:10 (Figure 1d). Figures 1b and 1c are the images in between this time frame. |