|
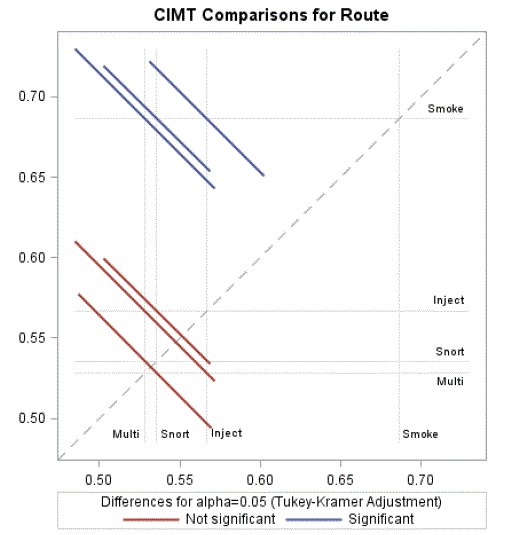
| Figure 3: Diffogram (and associated 95% Tukey-Kramer-adjusted confidence intervals) comparing pairs of adjusted (least-square) mean CIMT values by route of exposure. Graph abbreviations: ‘Smoke’ for smoking, ‘Inject’ for injecting, ‘Snort’ for snorting, and ‘Multi’ for multiple routes. To determine the difference in adjusted means for a pair of routes determine intersection of vertical line for one route and horizontal line for the other route. The confidence interval is interpreted as being perpendicular to the diagonal (45°) dashed line. In particular, a confidence interval that crosses the diagonal line indicates a pair of means is not significantly different from each other (e.g. Snorting and Injecting) while a confidence interval that does not cross the diagonal line indicates a pair of means that are significantly different from one another (e.g. Smoking and Injecting). |