 |
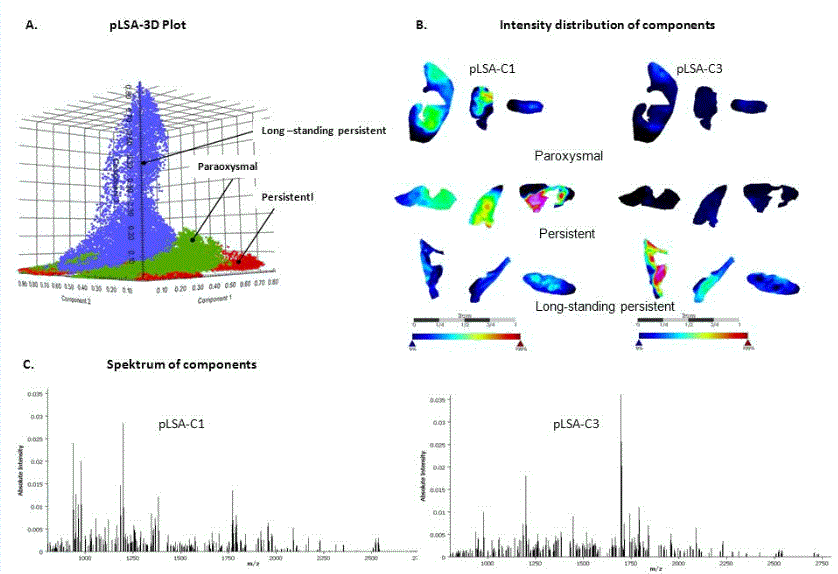
| Figure 2: Classification of the mass spectra from AF phenotypes by probabilistic latent semantic analysis. (A) pLSA-component 1 (pLSA-C1), pLSA-component 2 (pLSA-C2) and pLSA-component 3 (pLSA-C3) results in discrimination of spectra from PX, PE, to LP. (B) In particular, the spectra from LP AF tissue are characterized by low values for pLSA-C1 and high values for pLSA-C3. |