 |
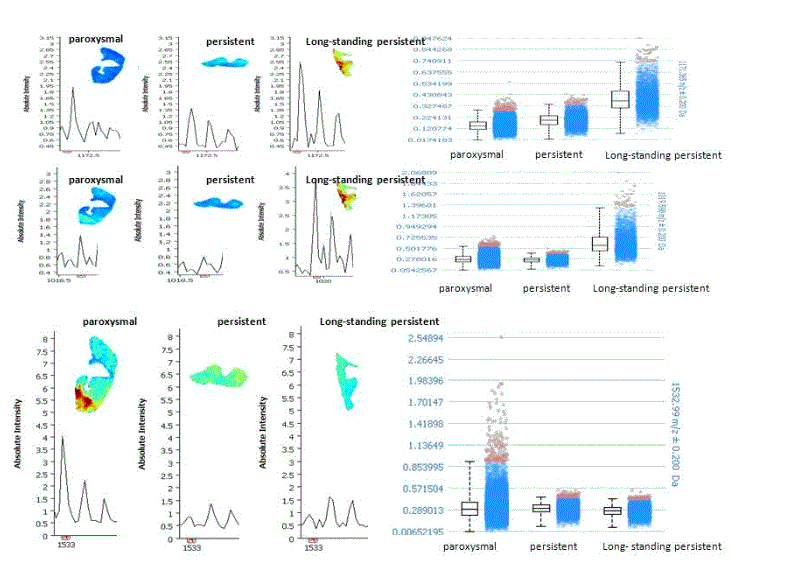
| Figure 3: Characteristic m/z values from AF phenotypes. Spatial distribution of characteristic m/z values for paroxysmal (PX), persistent (PE), and long-standing persistent (LP) atrial fibrillation types. The m/z value of 1171.37 showed significantly higher spatial intensities in LP and PE than that in PX. Further, the m/z values 1019.60 indicate lower spatial intensities in PX in comparison to LP and PE. The corresponding m/z values 1532.99 show an increase in spatial intensities in PX in comparison to LP and PE. |