|
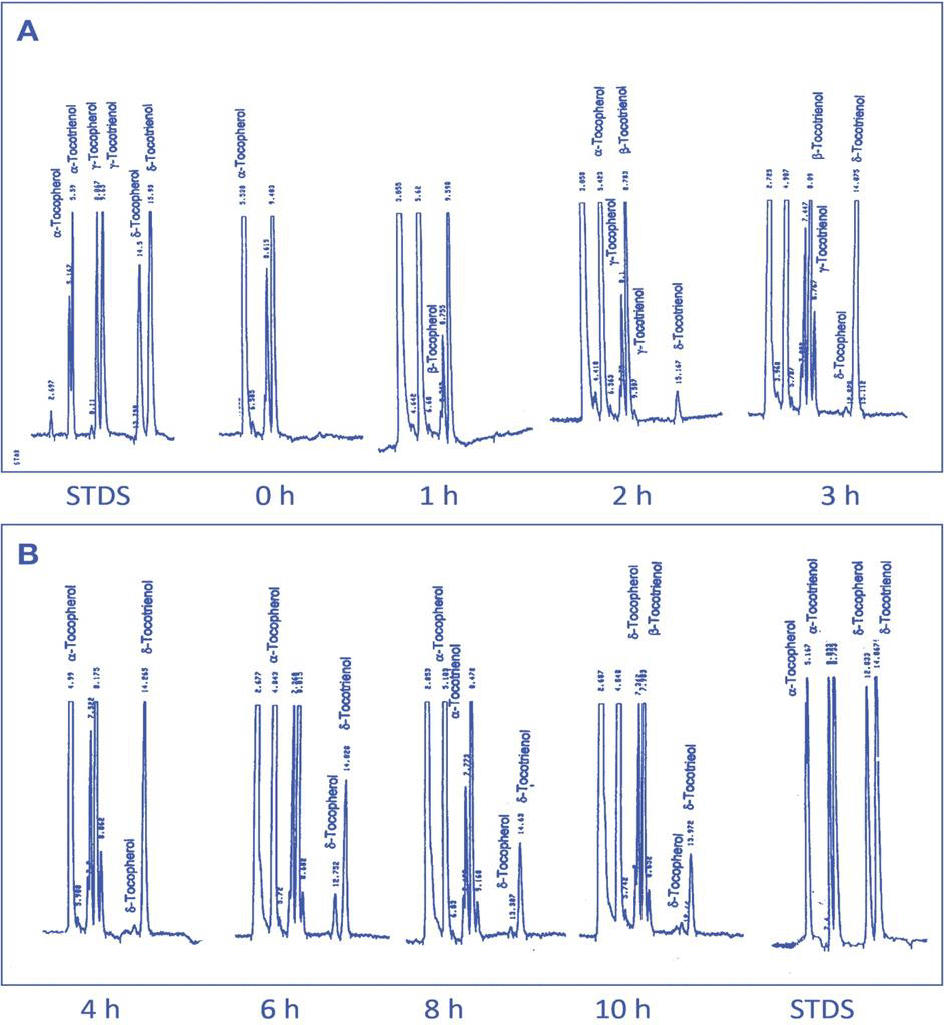
| Figures 2A and 2B: A typical HPLC elution profile of plasma sample on normal phase silica column after administration of single dose of 125 mg, 250 mg, or 500 mg of DeltaGold-based δ-tocotrienol: There were no peaks of δ-tocotrienol and δ-tocopherol of all plasma samples of 125 mg participants at 0 h and 1 h (only α-, β-, γ-tocopherol, and β-tocotrienol). Small peak of δ-tocotrienol appeared after 2 h, and reached maximum 3 h, small peak of δ-tocopherol was also appeared at 3 h (Figure2A), then started declining the levels of δ-tocopherol and δ-tocotrienol after 4 h -10 h (Figure 2B). Similar patterns of HPLC profile was noted throughout HPLC analyses of all samples (Figures 2A and 2B). |