 |
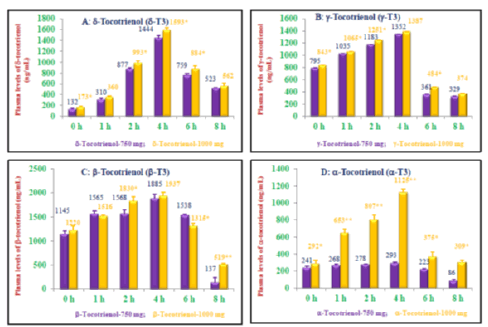
| Figure 2: Plasma peak concentrations (Cmax, ng/ml) of δ-, γ-, β, α- tocotrienols of various doses: The single dose of 750 mg or 1000 mg of DeltaGold-based δ- tocotrienol was administered in one day to healthy fed subjects. The plasma samples were collected at different time points from each subject, and processed to carry out normal phase HPLC analyses as described in Materials and Methods section. 2A: The plasma concentration of δ-tocotrienol at 0 h, 1 h, 2 h, 4 h, 6 h, and 8 h time points. 2B: The plasma concentration of γ- tocotrienol at 0 h – 8 h time points. 2C: The plasma concentration of β-tocotrienol at 0–8 h time points. 2D: The plasma concentration of α-tocotrienol at 0–8 h time points. Values are means ± standard deviation (n=3/dose). Values are significantly different compared to 750 mg dose versus 1000 mg dose at *P<0.05; or **P<0.01 from each other. |