|
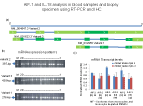
| Figure 2: A diagram of AIF-1 variants (isoforms) and mRNA transcripts is illustrated. (a): the three isoforms have a partial sequence homology. The isoform 1 has an identical C-terminal with the isoform 3, and the isoform 2, is different in both terminals with isoform 1 and isoform 3. (b): mRNA expression pattern for the three isoforms is illustrated. 1 to 20 indicate patients samples, of which odd numbers represented mRNA tested from monocytes and even numbers mRNA from monocyte depleted PBMCs. (c): mRNA transcript levels calculated after they were normalized to β-Actin expression levels. |