 |
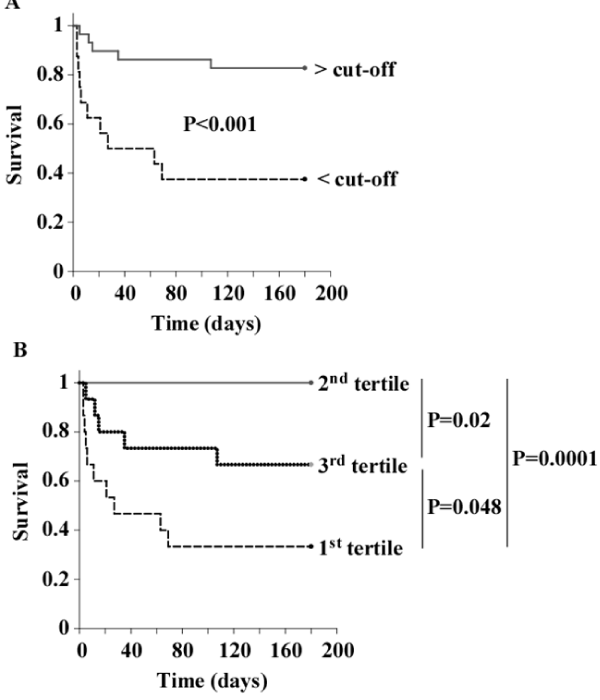
| Figure 3: Survival analysis. Kaplan-Meier curves showing the mortality of patients from the PCR cohort (n=45) according to CX3CR1 expression, as dichotomized by the cut-off value of 0.52 determined by ROC curves (A) or as divided in tertiles (B). P values are indicated. |