 |
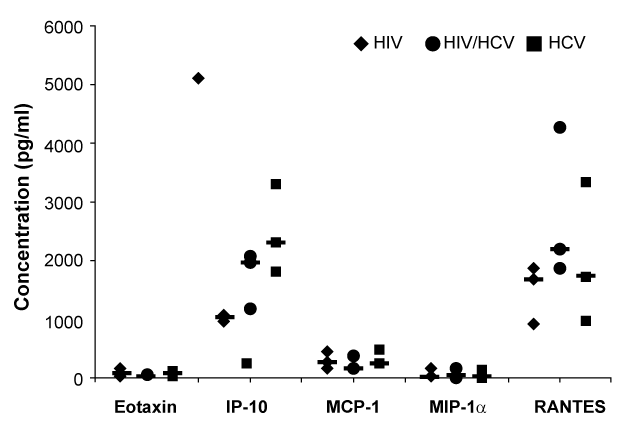
| Figure 2: Plasma concentrations of various chemokines. The individual and median concentrations of various chemokines from HIV mono, HIV-1/HCV co-infected, and HCV mono-infected individuals (n=3 for each condition and are represented by diamond, circle and square symbols, respectively). The median value is represented by a bar. |