 |
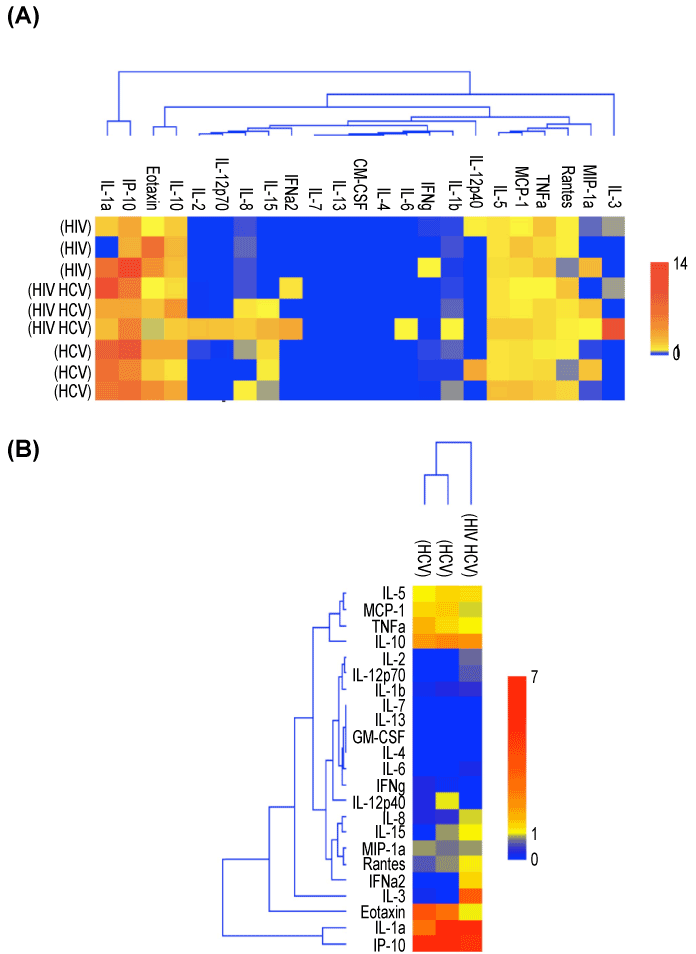
| Figure 3: Cluster and pattern analysis of plasma cytokine and chemokine expression in infected individuals. (A) Cluster representation of the absolute concentrations of various cytokines and chemokines. (B) The derived concentrations were normalized to healthy donor plasma and a pattern analysis was performed using a core developed software suite specific for Luminex® analysis. Results are presented as the mean plasma cytokine value for the sample (S) over the concentration from normal donor plasma (D) for that cytokine ({S/n)}/(D)) and arranged as an unsupervised distance clustered intensity plot. |