 |
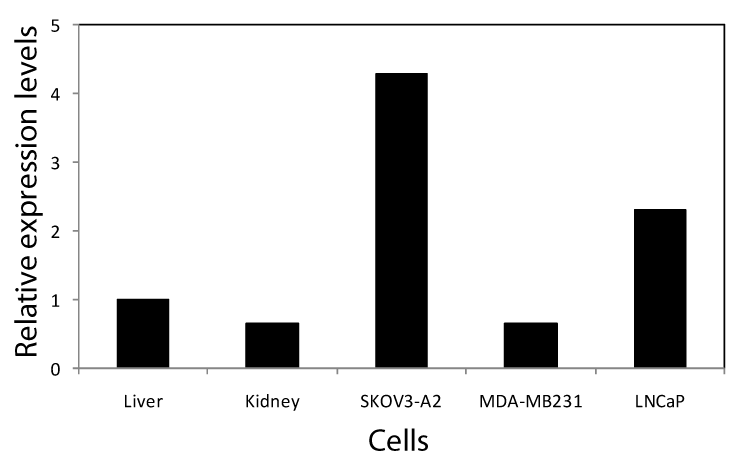
| Figure 6: Expression level of EDDR1 in normal and cancer cells by Realtime-qRT-PCR analysis: Realtime-qRT-PCR analysis was carried out using RNA isolated from normal tissues (liver and kidney) or cancer cell lines (ovarian cancer cell line SKOV3-A2, breast cancer cell line MDA-MB231 and prostate cancer cell line LNCaP) to determine the transcript levels of EDDR1. GAPDH was used as internal control. Data analysis was carried out employing ΔΔCt method. Results are presented as fold difference of EDDR1 expression in cancer cell lines over the control cells obtained from a normal liver tissue. |