|
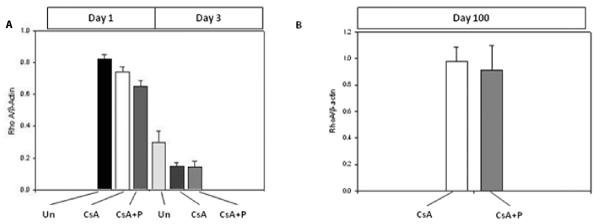
| Figure 1: Down regulation of Rho A in splenic T cells. (A) RT-PCR analysis shows significant reduction in transcriptional expression of RhoA at days 1 and 3 post transplantation with allochimeric MHC treatment (CsA+P) when compared to untreated (Un) and cyclosporine (CsA) treated controls (3 animals averaged per group). (B) The acute changes in splenic T cells return to or surpass baseline untreated controls at 100 day graft survival. (n=3). The data are presented as the fold change (RQ values) in gene expression level normalized to an endogenous reference gene. Standard error was calculated in Excel using formula STDEV(range) / SQRT(COUNT(range)) and plotted using Sigma plot. |