 |
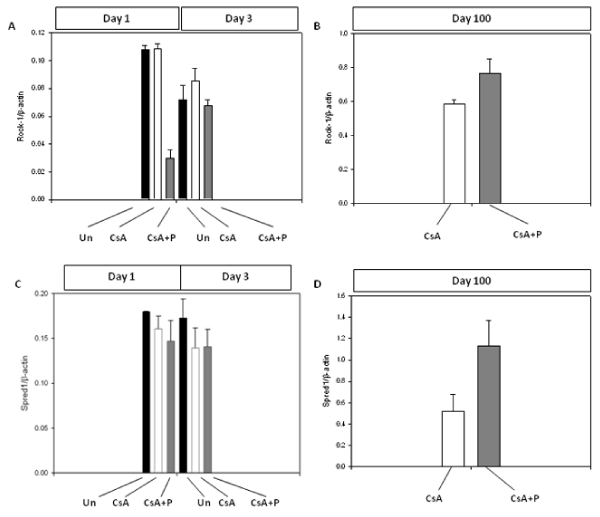
| Figure 2: Western blot analysis of splenic T cells. (A) Decreased ROCK-1 protein expression at day 1 and 3 post transplantation in allochimeric MHC (CsA+P) treated animals compared to controls. (B) Increased ROCK-1 protein expression at 100 days post transplantation in CsA+P treated animals. (C) Decreased Spred1 protein expression at day 1 and 3 in CsA+P treated animals compared to controls. (D) Increased Spred1 protein expression at 100 days post transplantation in CsA+P treated animals compared to controls. (n=3) Standard error was calculated in Excel using formula STDEV(range) / SQRT(COUNT(range)) and plotted using Sigma plot. |