 |
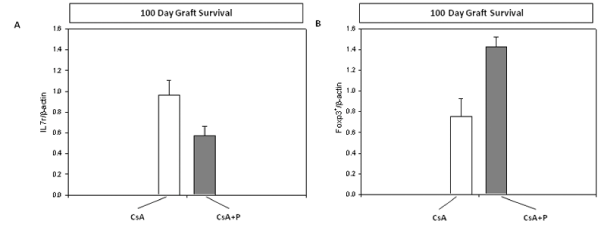
| Figure 3: IL-7r and Foxp3 protein expression in splenic T cells isolated at 100 days post transplantation following high dose CsA treatment or allochimeric class I MHC therapy (CsA+P). (A) RT-PCR showed significantly reduced expression of IL-7r in recipients treated with CsA+P compared to recipients treated with CsA alone. (B) RT-PCR showed elevated expression of Foxp3 in CsA+P treated recipients compared to recipients treated with CsA alone. (n=3). The data are presented as the fold change (RQ values) in gene expression level normalized to an endogenous reference gene. Standard error was calculated in Excel using formula STDEV(range) / SQRT(COUNT(range)) and plotted using Sigma plot. |