 |
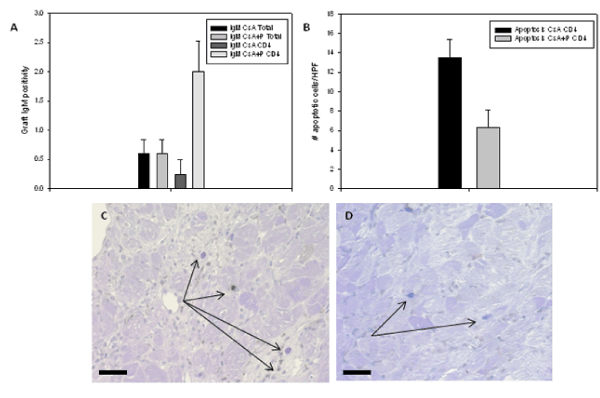
| Figure 7: IgM deposition and apoptotic assay of cardiac allografts. (A) Increased level of IgM deposition within allografts exposed to allochimeric protein conditioned CD4+ T cells compared to CsA alone- treated groups; n=5. (B) Tunel assay shows 50% reduction in the number of apoptotic cells in allografts exposed to CsA+P - conditioned CD4+ T cells as compared to CsA alone. (C&D) Cardiac allografts sections show apoptotic cells (black arrows) in the CsA alone - conditioned CD4+ group (C) compared to the CsA+P - conditioned CD4+ group (D), n=5. Apoptosis score was expressed as the number of apoptotic cells per heart cross-section. Standard error was calculated in Excel using formula STDEV(range) / SQRT(COUNT(range)) and plotted using Sigma plot. Bar is equal to 50μm. |