 |
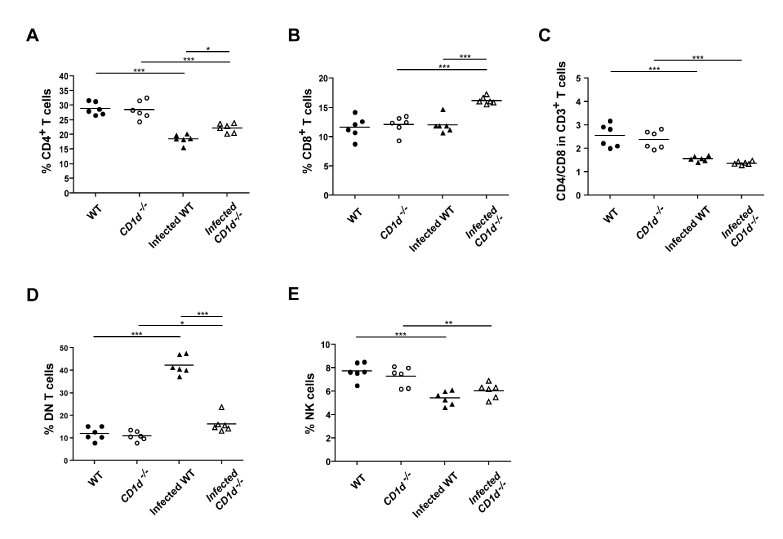
| Figure 2: FACS analysis of T cell and NK cell populations with and without P. pneumotropica infection. Percentage of (A) CD4+ T cells, (B) CD8+ T cells, (C) the CD4/CD8 ratio in CD3+ T cells, (D) double negative (DN) in CD3+ T cells, and (E) NK cells (gated on CD3-NK1.1+DX5+ cells), for all four groups of mice (noninfected WT and CD1d-/- mice; and infected WT and CD1d-/-). Dot plots show individual values and the mean. One-way ANOVA test with Newman-Keuls multiple comparisons correction was used to evaluate significant differences among the groups, n = 6 mice/group, *P ≤0.05, **P ≤0.01, ***P ≤0.001. |