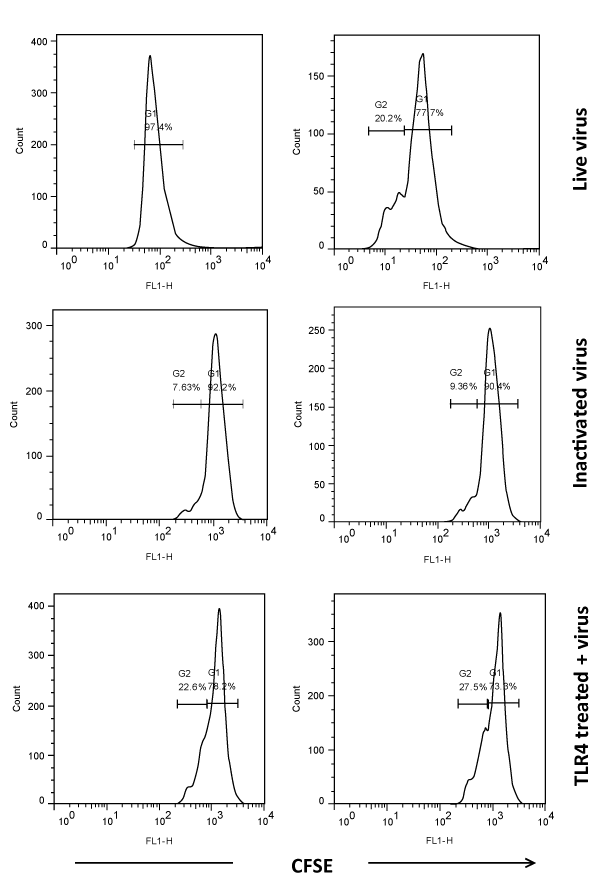
The B-cells were exposed to live and inactivated virus. In another experiment, the B-cells were treated with anti mouse TLR4/MD2 antibody and then exposed to live virus. The exposed cells were stained with CFSE. The stained cells were incubated for 72 h at 37oC. The CFSE stained, virus unexposed cells were kept as a control. At the end of incubation, the cells were then stained with anti mouse CD19-PE. The stained cells were acquired in FACSCalibur using cell quest pro software. The proliferation of cells was analyzed using Flow Jo software. During analysis, the CD19 positive cells were gated first for analysis of CFSE positive cells. In the histogram, CFSE positive cell population is located near to 102 (live virus) and 103 (Inactivated and TLR4 treated) in X axis (parent population) and other peaks which fall left to parent population are daughter population. The percentage of cells positive for CFSE was calculated and mentioned inside the histogram. These are representative picture of one of three experiments.