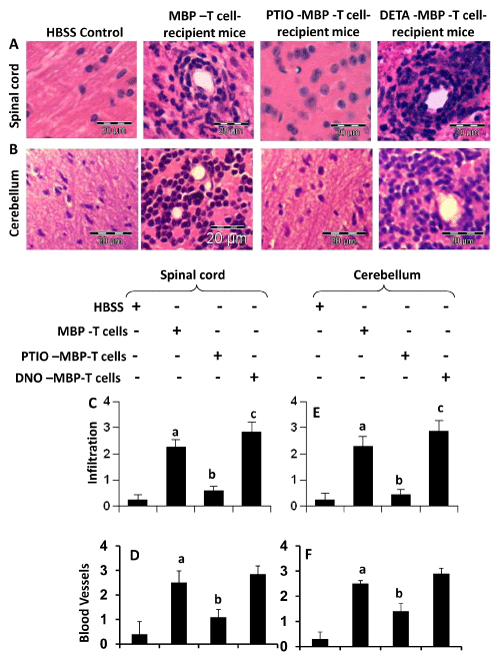
 On 14 dpt (acute phase), spinal cord (A) and cerebellar (B) sections isolated
from HBSS-treated (normal), MBP-primed T cell-treated, PTIO-incubated
MBP-primed T cell-treated, and DNO-incubated MBP primed T cell-treated
mice were stained with H & E. Digital images were collected under bright field
setting. Infiltration (C & E) and cuffed vessels (D & F) in spinal cord (C & D)
cerebellar (E & F) sections were represented quantitatively by using a scale
as described under methods section. Data are expressed as the mean ± SEM
of five different mice per group. ap < 0.001 vs HBSS (normal); bp < 0.001 vs
MBP-primed T cells; cp < 0.05 vs MBP-primed T cells.
On 14 dpt (acute phase), spinal cord (A) and cerebellar (B) sections isolated
from HBSS-treated (normal), MBP-primed T cell-treated, PTIO-incubated
MBP-primed T cell-treated, and DNO-incubated MBP primed T cell-treated
mice were stained with H & E. Digital images were collected under bright field
setting. Infiltration (C & E) and cuffed vessels (D & F) in spinal cord (C & D)
cerebellar (E & F) sections were represented quantitatively by using a scale
as described under methods section. Data are expressed as the mean ± SEM
of five different mice per group. ap < 0.001 vs HBSS (normal); bp < 0.001 vs
MBP-primed T cells; cp < 0.05 vs MBP-primed T cells.