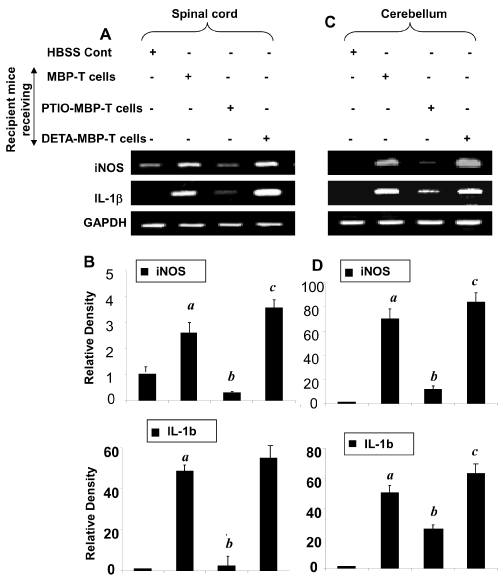
 On 14 dpt, spinal cord (A & B), and cerebellum (C & D) of HBSS-treated
(normal), MBP-primed T cell-treated, PTIO-incubated MBP-primed T celltreated,
and DNO-incubated MBP primed T cell-treated mice were analyzed
for the mRNA expression of iNOS and IL-1ß by semi-quantitative RT-PCR (A
& C). Relative band density is presented in B & D. Data are expressed as the
mean ± SEM of five different mice per group. ap < 0.001 vs HBSS (normal); bp
< 0.001 vs MBP-primed T cells; cp < 0.05 vs MBP-primed T cells.
On 14 dpt, spinal cord (A & B), and cerebellum (C & D) of HBSS-treated
(normal), MBP-primed T cell-treated, PTIO-incubated MBP-primed T celltreated,
and DNO-incubated MBP primed T cell-treated mice were analyzed
for the mRNA expression of iNOS and IL-1ß by semi-quantitative RT-PCR (A
& C). Relative band density is presented in B & D. Data are expressed as the
mean ± SEM of five different mice per group. ap < 0.001 vs HBSS (normal); bp
< 0.001 vs MBP-primed T cells; cp < 0.05 vs MBP-primed T cells.