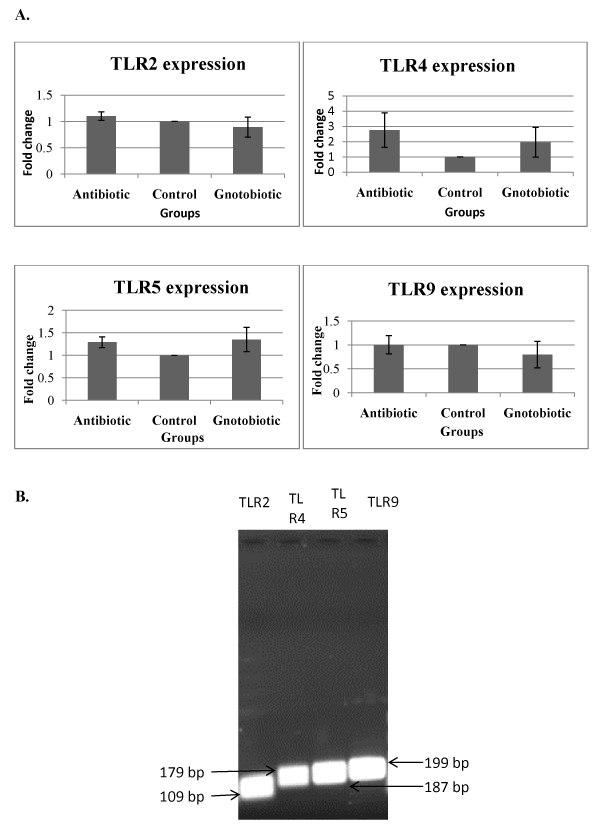
 Ileal tissue samples were collected from different groups of pigs at 5 weeks
of age, snap frozen in liquid nitrogen and stored at -80°C. Total RNA was
extracted from frozen tissue samples and was used to prepare amplified RNA
(aRNA). aRNA was reverse transcribed to cDNA and was used for quantitative
real-time RT-PCR (qRT-PCR). The β-actin was used as a house keeping/
reference gene and its expression was used for normalization of TLRs. (A).
The fold change is obtained by normalizing the target gene to the reference
gene for both treated and control pigs using 2-ΔΔCt method. Fold change = 2 -(Ct
value of target gene of treated animal - Ct value of reference gene of treated animal) – (Ct value of target gene of control animal – Ct
value of reference gene of control animal). The data was analyzed using the Student’s paired
t-test and P-values < 0.05 were considered statistical significant. P values
for TLR-2 expression diffferences between antibiotics (A) vs control (C),
antibiotics (A) vs gnotobiotics (G) and control (C) vs gnotobiotics (G) groups
were 0.30, 0.54 and 0.61 respectively. P values between A-C, A-G and C-G
groups for TLR-4 expression differences were 0.19, 0.20 and 0.37; for TLR-5
expression were 0.09, 0.53 and 0.26, and for TLR-9 expression were 0.99,
0.05 and 0.50 respectively. (B). TLR-2, -4, -5 and -9 qRT-PCR products were
run on 1% agarose gel. The PCR products of expected sizes of 109, 179, 187,
and 199 bps were obtained.
 |
 Ileal tissue samples were collected from different groups of pigs at 5 weeks
of age, snap frozen in liquid nitrogen and stored at -80°C. Total RNA was
extracted from frozen tissue samples and was used to prepare amplified RNA
(aRNA). aRNA was reverse transcribed to cDNA and was used for quantitative
real-time RT-PCR (qRT-PCR). The β-actin was used as a house keeping/
reference gene and its expression was used for normalization of TLRs. (A).
The fold change is obtained by normalizing the target gene to the reference
gene for both treated and control pigs using 2-ΔΔCt method. Fold change = 2 -(Ct
value of target gene of treated animal - Ct value of reference gene of treated animal) – (Ct value of target gene of control animal – Ct
value of reference gene of control animal). The data was analyzed using the Student’s paired
t-test and P-values < 0.05 were considered statistical significant. P values
for TLR-2 expression diffferences between antibiotics (A) vs control (C),
antibiotics (A) vs gnotobiotics (G) and control (C) vs gnotobiotics (G) groups
were 0.30, 0.54 and 0.61 respectively. P values between A-C, A-G and C-G
groups for TLR-4 expression differences were 0.19, 0.20 and 0.37; for TLR-5
expression were 0.09, 0.53 and 0.26, and for TLR-9 expression were 0.99,
0.05 and 0.50 respectively. (B). TLR-2, -4, -5 and -9 qRT-PCR products were
run on 1% agarose gel. The PCR products of expected sizes of 109, 179, 187,
and 199 bps were obtained.