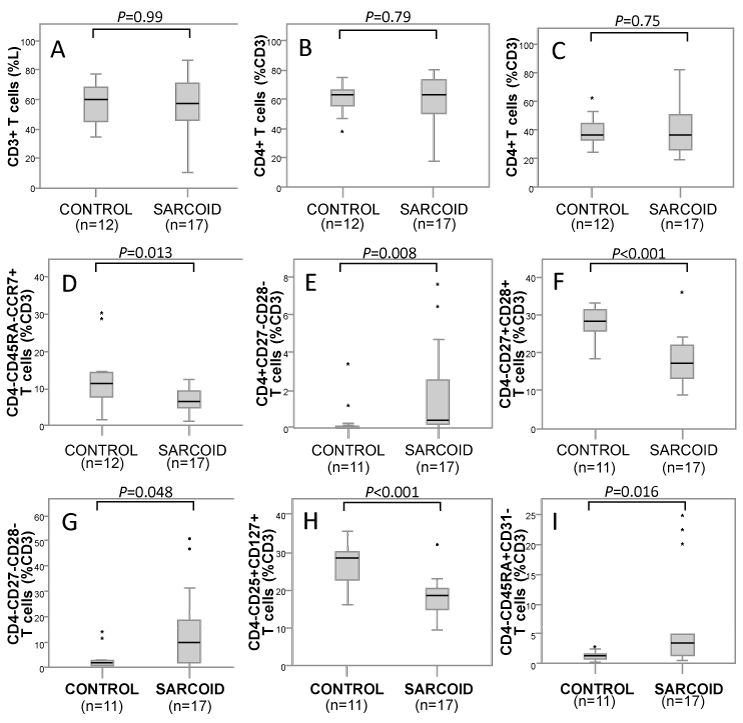
T lymphocytes were analysed in whole blood using forward and side scatter with surface CD3 staining (A). Total helper and cytotoxic T cells memory were analysed by the presence or absence of CD4 surface staining (B & C). Naïve T cells were identified by the surface expression of CD45RA and CCR7 (D). The co-stimulatory molecule CD27 and CD28 were used to identify activated and terminally differentiated T cells (E, F & G). Box plots H and I show CD4-CD25- CD127+and CD4-CD45RA+CD31- T cells respectively.