 |
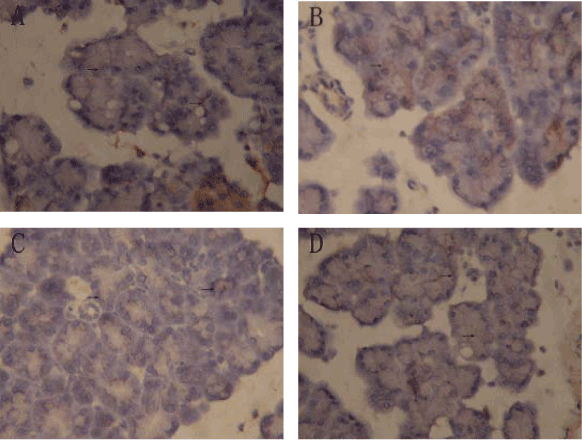
| Figure 5: Representative BCL-2 immunohistochemistry of pancreas histopathology. (A) CON group at 24h. (B) SAP group at 24h. (C) ROSI group at 24h. (D) GW9662 group at 24h. Comparison of the gray value of acinus of pancreas. B,C,DP<0.05 vs. the CON group. CP<0.05 vs. the SAP group. DP<0.05 vs. the ROSI group (magnification of ×40). |