 |
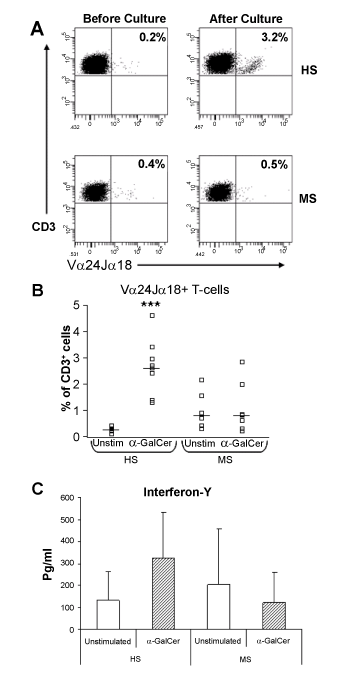
| Figure 3: NKT-cell responses to α-GalCer are impaired in MS. (A) Representative flow cytometric profiles of Vα24Jα18+ T-cells (NKT-cells) from one healthy subject (HS) and one MS patient. The frequency of NKTcells before and after culture with α-GalCer is shown in the upper upper-right hand quadrants in each plot. (B) Percentages of NKT-cells in unstimulated (medium alone) and α-GalCer stimulated cultures in 8 healthy subjects and 7 MS patients. Horizontal bars indicate median levels. (C) IFN-γ production in unstimulated PBMC cultures or in α-GalCer stimulated cultures in HS and MS patients. Data shows mean levels and error bars show the standard deviation. Significance values comparing HS to MS patients are shown by ***, P<0.001. From O’Keeffe et al. [57]. |