 |
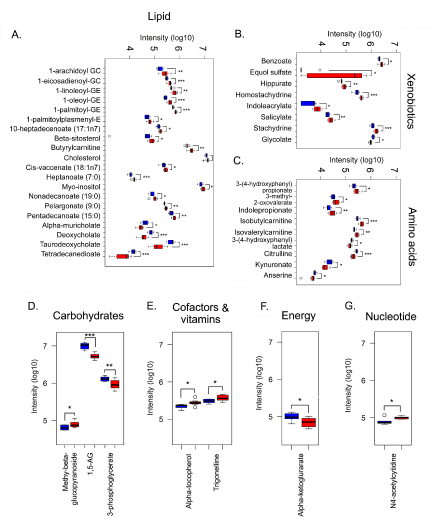
| Figure 3: Box plots of various metabolite classes altered in EAE. Significantly altered metabolite intensities are shown as box plots grouped by class: lipid (i), xenobiotics (ii), amino acids (iii), carbohydrates (iv), cofactors and vitamins (v), energy (vi) and nucleotide (vii). Medians are represented by horizontal bars, boxes span the interquartile range (IQR) and whiskers extend to extreme data points within 1.5 times IQR. Outliers plotted as open circles lie outside 1.5 times the IQR. Blue and red box plots represent healthy and EAE group, respectively. *P<0.05; **P<0.01; ***P<0.001 compared to healthy group. Abbreviation used for following lysolipids: 1-arachidoyl GC: 1-arachidoylglycerophosphocholine; 1-eicosadienoyl GC: 1- eicosadienoylglycerophosphocholine; 1-linoleoyl GE: 1- linoleoylglycerophosphoethanolamine; 1-oleoyl GE: 1-oleoylglycerophosphoethanolamine; 1-palmitoyl GE: 1- palmitoylplasmenylethanolamine; 1-palmitoylplasmenyl E: 1-palmitoylplasmenylethanolamine. |