 |
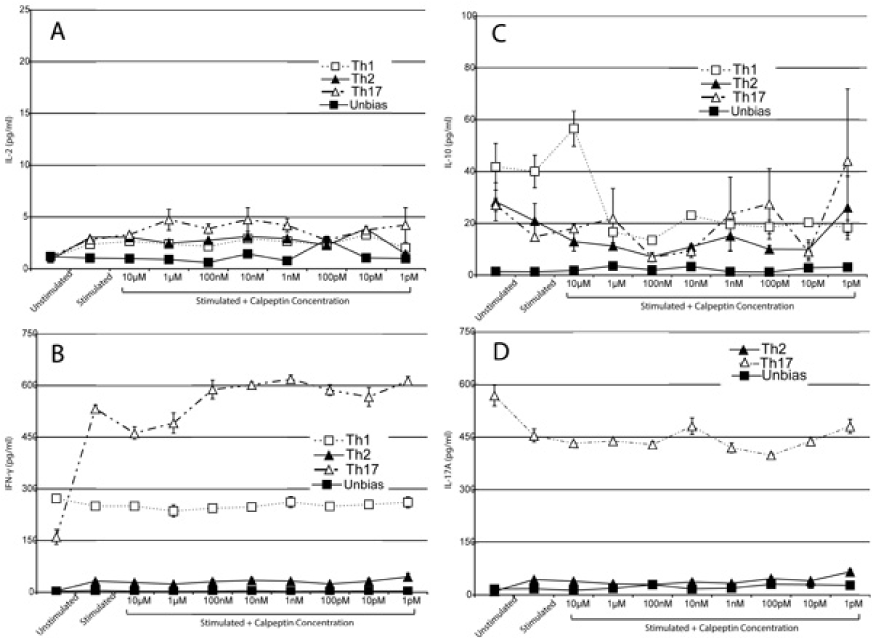
| Figure 4: The Subtype cytokines. A. comparison of the cytokine production of all the subtypes of Th cells as measured by ELISA assay when stimulated with MBP Ac1-8 peptide in the presence of various concentrations of the calpain inhibitor calpeptin. The cytokine profiling was performed to determine if calpain inhibitor at various concentrations was having any effect on the cytokine production. A. compares the production of IL-2 for the various subtypes. B. compares the production of IFN-γ for the various subtypes. C. Comparison of the production of IL-10 in the various subtypes. D. Comparison of the production of IL-17A in the various subtypes. Mean ± SEM (n=3). |