|
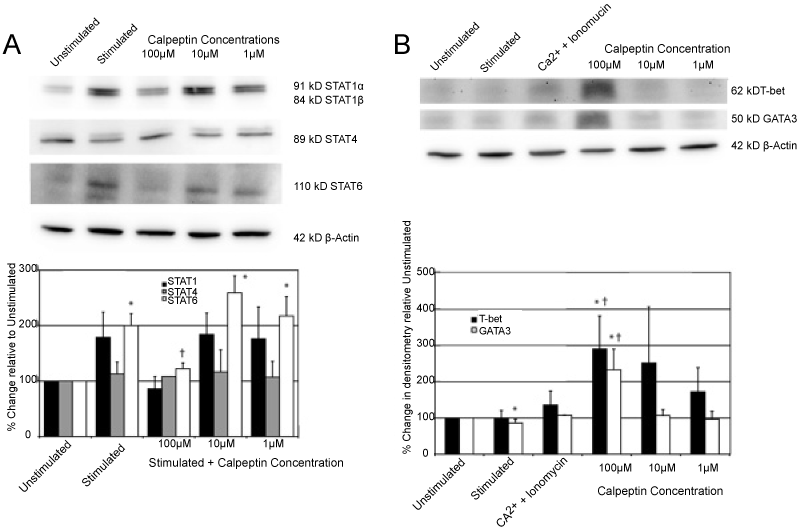
| Figure 5: The effect of calpeptin on STAT protein levels. Changes in various STAT proteins in MBP Ac1-11-specific T cells following stimulation with MBP Ac1-8 and various concentrations of the calpain inhibitor calpeptin. A. Representative Western blots showing 91kD STAT1α, 84 kD STAT1β, 89 kD STAT4, 110 kD STAT6 and 42 kD β-actin. Densitometric analysis showing percent changes in the various STAT proteins relative to the unstimulated control group set at 100. Mean ± SEM (n=4). *, p<0.05 stimulated vs. unstimulated control; †, p<0.05 stimulated vs. stimulated group without calpeptin. B. Changes in the T-bet and GATA3 transcription factors in MBP Ac1-11-specific T cells following stimulation with MBP Ac1-8 and various concentrations of the calpain inhibitor calpeptin. The Ca2+ + ionomycin group is a positive control group to contrast calpain activation to calpain inhibition. Representative Western blots showing 62 kD T-bet, 50 kD GATA3 and 42 kD β-actin. Densitometric analysis showing percent changes in the T-bet and GATA3 proteins relative to the unstimulated control group set at 100. Mean ± SEM (n=3). *, p<0.05 stimulated vs.unstimulated control; †, p<0.05 stimulated vs. stimulated group without calpeptin. |