 |
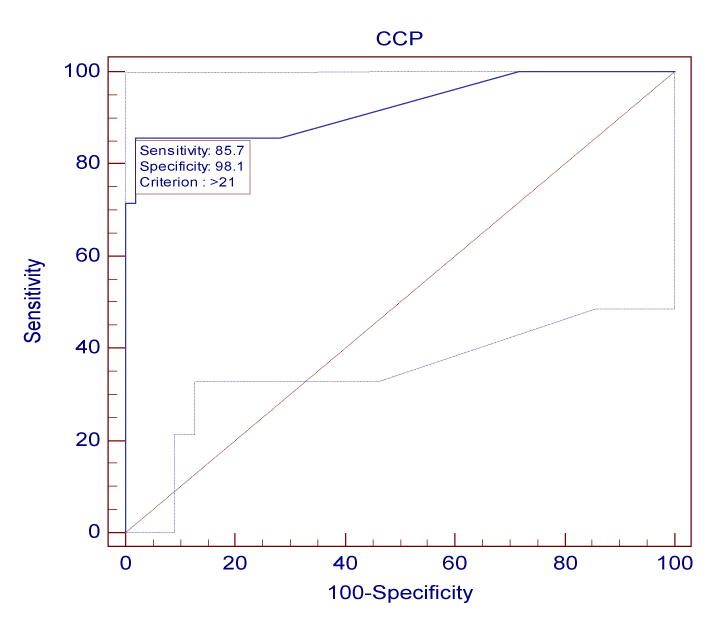
| Figure 4: Receiver operator characteristic curve (ROC) assessing the validity of the anti-CCP2 test in diagnosing RA. The area under the curve was 0. 923 at the 95% CI. The sensitivity of each test is plotted against one minus specificity for varying cutoffs (values lower than the cutoff were considered negative, and other values were considered positive) (n=40). |