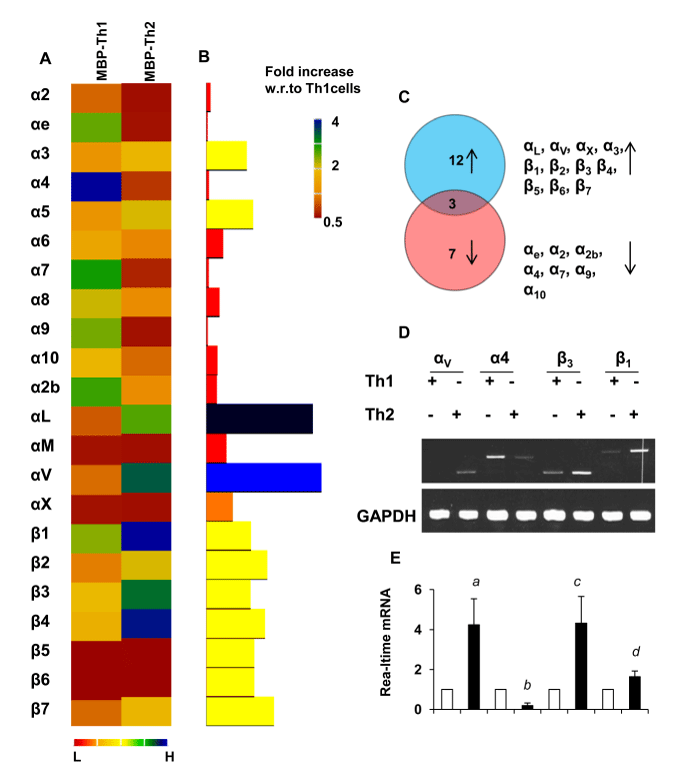
Th1 and Th2 cells were analyzed for the expression of different integrins by super array gene array analysis (Super Array). (A) Heatmap analysis of differential expression of α and β integrin molecules in Th1 and Th2 cells. (B) The histogram analysis of super array. Red indicates the minimum and blue indicates the maximum expression in the scale. (C) Venn diagram analysis summarizes the number of integrins upregulated (blue circle), downregulated (red circle), and unaltered (common area) in MBP-primed Th2 cells compared to Th1 cells. The mRNA expression of αV, α4, β1, and β3 in Th1 and Th2 cells was verified by semi-quantitative RT-PCR (D) and realtime PCR (E) analyses. Results represent three independent experiments. ap<0.01, bp<0.05, cp<0.01, and dp<0.05 vs. control expression of αV, α4, β3, and β1 respectively.