 |
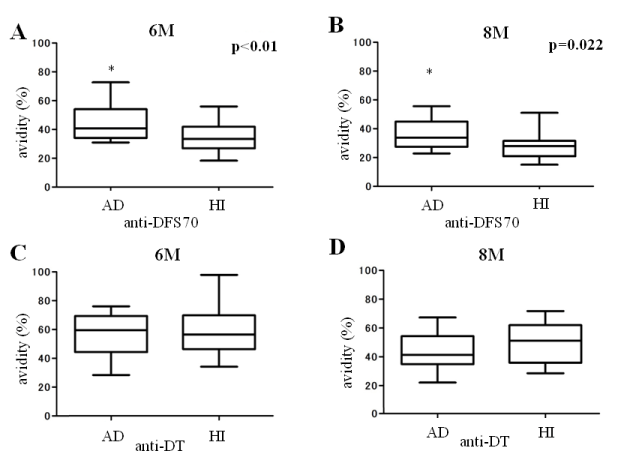
| Figure 1: The avidity of anti-DFS70 autoantibodies in atopic dermatitis compared to healthy controls: Avidity of antibodies (%) was measured by the following formula: 100×corrected OD with urea treatment/corrected OD without urea treatment. The avidity of anti-DFS70 (A and B) and anti-DT (C and D) in patients with AD and healthy individuals (HI) when 6 M (A and C) and 8 M (B and D) urea treatment was performed in the ELISAs. Data are presented as box plots, where the boxes represent the 25th to 75th percentiles, the lines within the boxes represent the median and the lines outside the boxes represent the maximum and minimum values. Differences were analyzed by Mann-Whitney U-test, and statistically significant differences are indicated (*P<0.05). |